How to Use the HData Visual Analysis App
Overview
Located within the Insights module of the HData platform, the Visual Analysis app provides a full suite of tools for creating interactive visualizations of data from any FERC form.
Choose from a range of eight different chart styles and download underlying data sets in just a few clicks. You can also share the visualizations you build with recipients inside and outside your organization through a unique, auto-generated URL.
Getting Started
To access the Visual Analysis app, navigate to the “Insights” link located on the left-side menu on the HData home screen.
Find the “My Apps” menu on the Insights home screen.
Scroll to the bottom of the list and click “Visual Analysis” to access the app.
NOTE: Clicking on the Visual Analysis link will open a separate tab in your web browser with the following URL: https://hdata.idaciti.com/analysis/#/cards. You can still easily tab back over to the main HData platform to access other apps.
Viewing Existing Cards
On the main screen of the Visual Analysis app, you will see a toggle button in the upper left-hand corner with the options: “Shared with me” and “Owned by me.”
By default, this button is set to “Owned by me.”
If you are using the app for the first time and have not created any data visualization projects, you will notice that no cards appear on the page.
To see if any cards have been shared with your HData profile, move the toggle to the “Shared with me option.” If projects have been shared with your profile, they will load on the screen.
You can click into each card to access the charts and underlying data sets.
Creating a New Card
To create a new card, click the “Add New Card” button, located to the right of the toggle. 
Go to the “Search Selected Companies” field, located on the left-hand side of the screen.
Use this field to add the companies that you want to include in your analysis.
Next, click the “Search Term” field and search for the FERC Form 1 term by name. You may need to scroll to find it.
Click the term to add it to your analysis.
Click the “Refresh Card” button just below the search field to start populating your new card. 
Visualizing the Data
Start by choosing one of the available chart types to instantly visualize the data in the new card you have created.
You can access eight different chart formats.
Simply hover over the icons in the menu bar to identify the chart you want to use. Then click that icon to visually display the source data from your initial search. 
You can click the two squares at the upper right side of the visualization to flip the card over and view the source data.
Accessing and Exporting Source Data and Visuals
With the card now flipped over to show the source data, you can click on any number in the table to track it back to the FERC form where it was originally derived. 
Data can also be exported from this view by clicking the “Export Data” button to download the dataset to your local device. 
Flip the card back over using the two squares icon in the upper-right-hand corner to get back to the data visualization view.
From there, click on the hamburger menu just below the two squares to access a menu of export options. 
Saving and Your Data Visualization Cards
To save a card for future reference, click “Save Card” and give the card a name and description. Click “Save and Close” to complete the process.
Your newly created card will now appear on the main screen whenever you are accessing the Visual Analysis tool.
To access any card you’ve saved, you can hover over it and click to open it. You can also choose to share or delete it from this view.
Sharing Data Visualization Cards
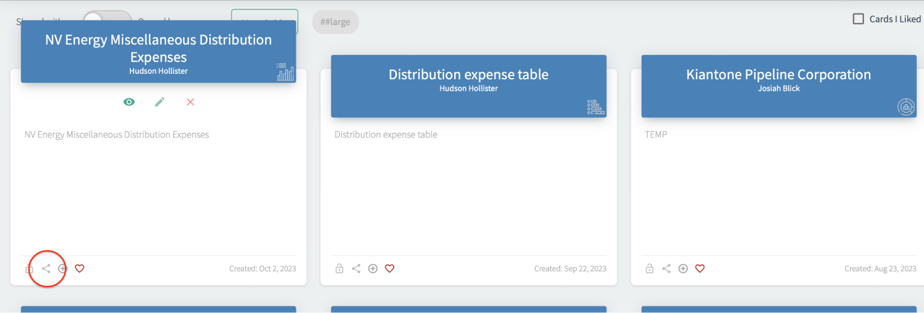
On the Visual Analysis home screen, you’ll find your list of cards. Click the icon at the bottom of the card’s preview screen to share:
To share an interactive link of a visualization you created, open it. Click the “Share” icon at the top-left of your screen.

Use the “Copy to clipboard” option to copy the link, and paste it into emails and other message formats as you please.

NOTE: This link can be shared to non-HData users. They can view the visualization, flip the card and trace it to the FERC Form. They cannot edit or alter the visualization.
Questions? Let Us Know
Hopefully this article gave you all the information you needed to be successful with the HData Visual Analysis app. If you still need help, please reach out to us at support@hdata.us.